How Event Analytics Strengthens Compliance Reporting in Sports Events
Ask AI about this article
Large-scale sports events generate a huge volume of operational activity such as site inspections, safety checks, contractor tasks, crowd flows, asset deliveries, handovers and incident resolution. Compliance reporting is how you prove, to internal and external stakeholders, that all of that work happened on time, with the right approvals and with a traceable record.
That’s exactly where event analytics becomes a competitive advantage: it turns this operational data into auditable evidence and decision-ready insights.
In major competitions and high-attendance match days, compliance isn’t captured in a single report. It’s an ecosystem of obligations across:
The bigger the event, the more stakeholders are involved, including federations, clubs, venue owners, suppliers, cities, police, firefighters and broadcasters. Each with their own requirements and evidence expectations. A spreadsheet approach often breaks under this type of complexity.
In practice, compliance reporting is your ability to demonstrate:
In many event operations, compliance evidence is distributed across disconnected systems: email threads, messaging apps, paper checklists, individual drives and separate task trackers. This fragmentation creates inconsistent records and weak data integrity, making it difficult to demonstrate a complete, chronological audit trail. As a result, audits take longer, exceptions are harder to explain and stakeholders have less confidence in the reliability of compliance reporting.
Strong event analytics turns day-to-day venue operations into an evidence trail you can defend. Instead of chasing scattered updates, you get structured records that show what happened, where, when, and who approved it.
When compliance evidence is spread across multiple channels, you lose time and trust in the data. A single source of truth means operational information lives in one system with consistent structure and ownership.
What this enables for compliance reporting:
In major sports events, this matters because compliance is multi-stakeholder by default. One single source of truth reduces the friction between stakeholders and improves accountability.
In practice, the “single source of truth” problem is less about discipline and more about tooling. When your Venue Management System sits beside separate inspection, task, and reporting tools, compliance evidence will always be scattered.
For compliance reporting, location and map-linked data are non-negotiable. No task is meaningful unless you can prove where it was completed. Location-based evidence links compliance data to a specific room, gate, section or stand.
What this enables for compliance reporting:
For sports events, it’s also powerful because zones often have different compliance requirements. Analytics becomes more meaningful when it’s location-aware.
Compliance reporting isn’t just about proving something happened, it’s proving it happened at the right time, in the right phase (pre-event readiness, match-day checks, post-event restoration). Time-stamped workflows create a chronological record of actions and decisions.
What this enables for compliance reporting:
In high-pressure busy weeks, time stamping also reduces memory-based reporting after the fact. Instead of rebuilding what happened, you’re extracting an evidence-backed timeline.
Compliance reporting depends on data integrity. If anyone can edit anything at any time, your evidence becomes easier to question. Role-based access means each stakeholder sees and edits only what they are responsible for.
What this enables for compliance reporting:
For major sports events, this is especially relevant because external contractors and partners often need access, but not full access. Role-based access lets you collaborate without losing control.
Even with dashboards and all the event analytics in the world, compliance often ends in a deliverable: a PDF or Word report shared with a stakeholder. Exportable compliance reports turn live operational data into audit-ready documentation that’s easy to share, store and reference later.
What this enables for compliance reporting:
In practice, this is one of the highest ROI parts of event analytics: it reduces manual admin, accelerates audits and strengthens credibility.
Below are practical KPI groups you can use across sports events, with analytics-ready definitions.
Virtual Venue is designed to help major event organizers plan and deliver events efficiently through a shared, map-centric digital twin platform. In Virtual Venue, operations, evidence and analytics live in one place.
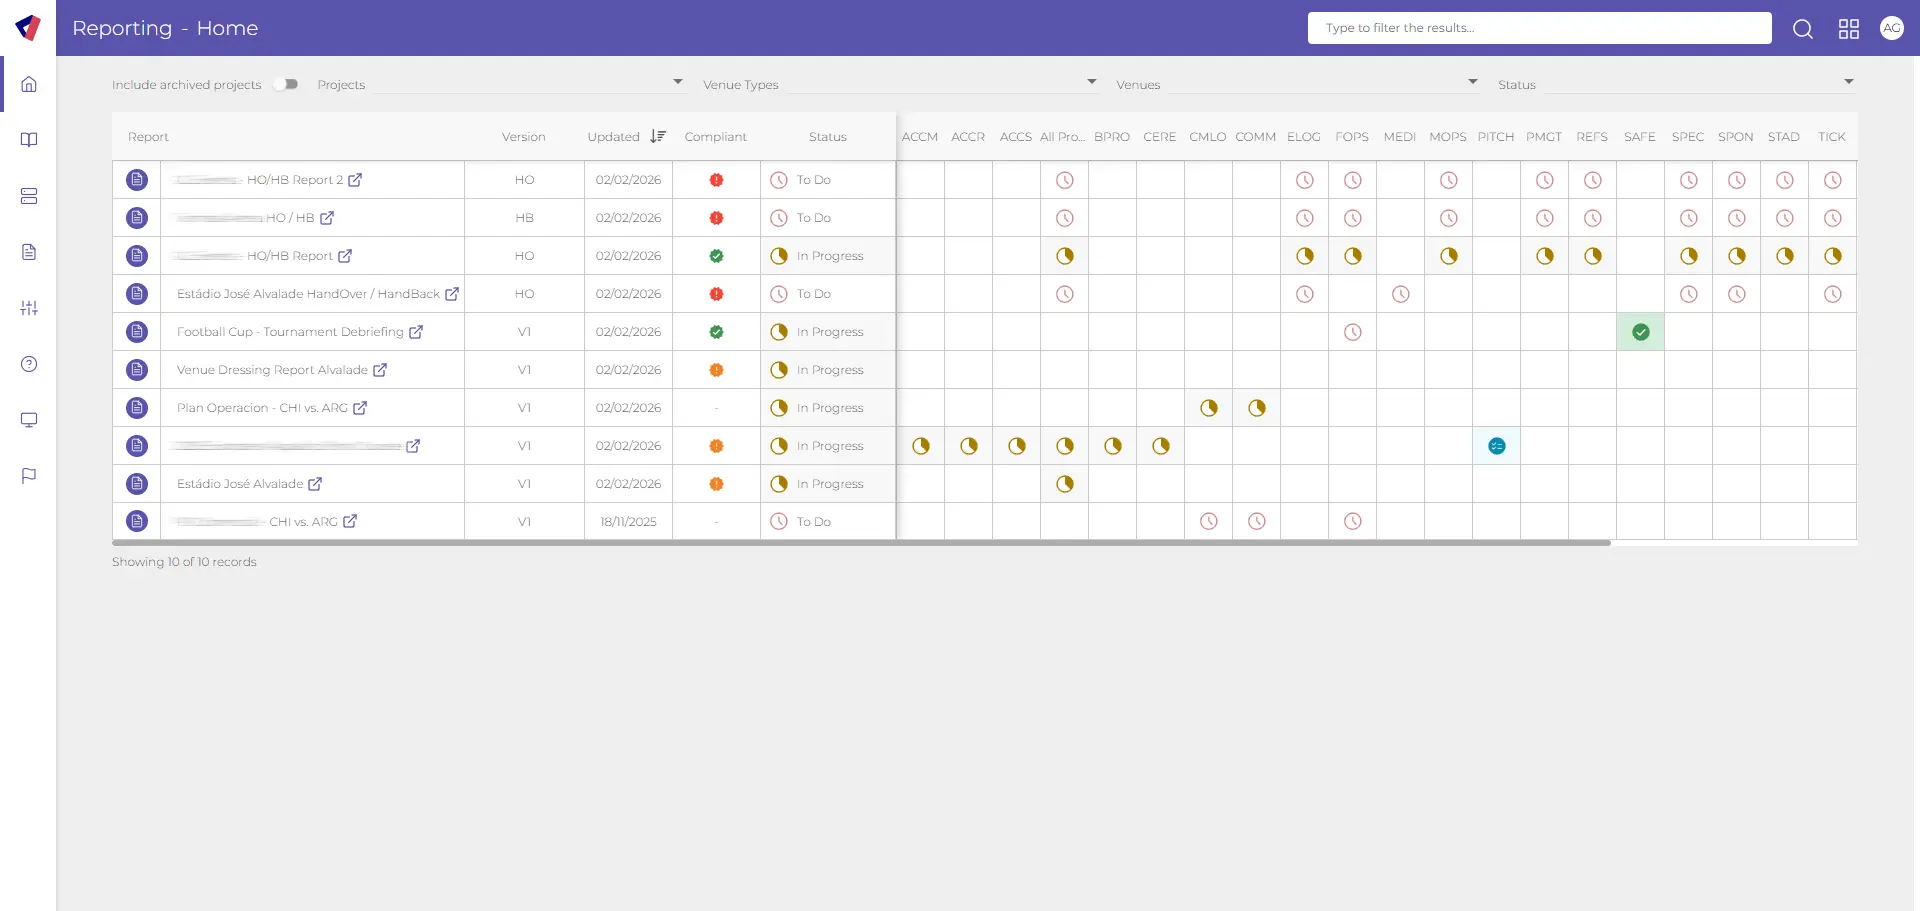
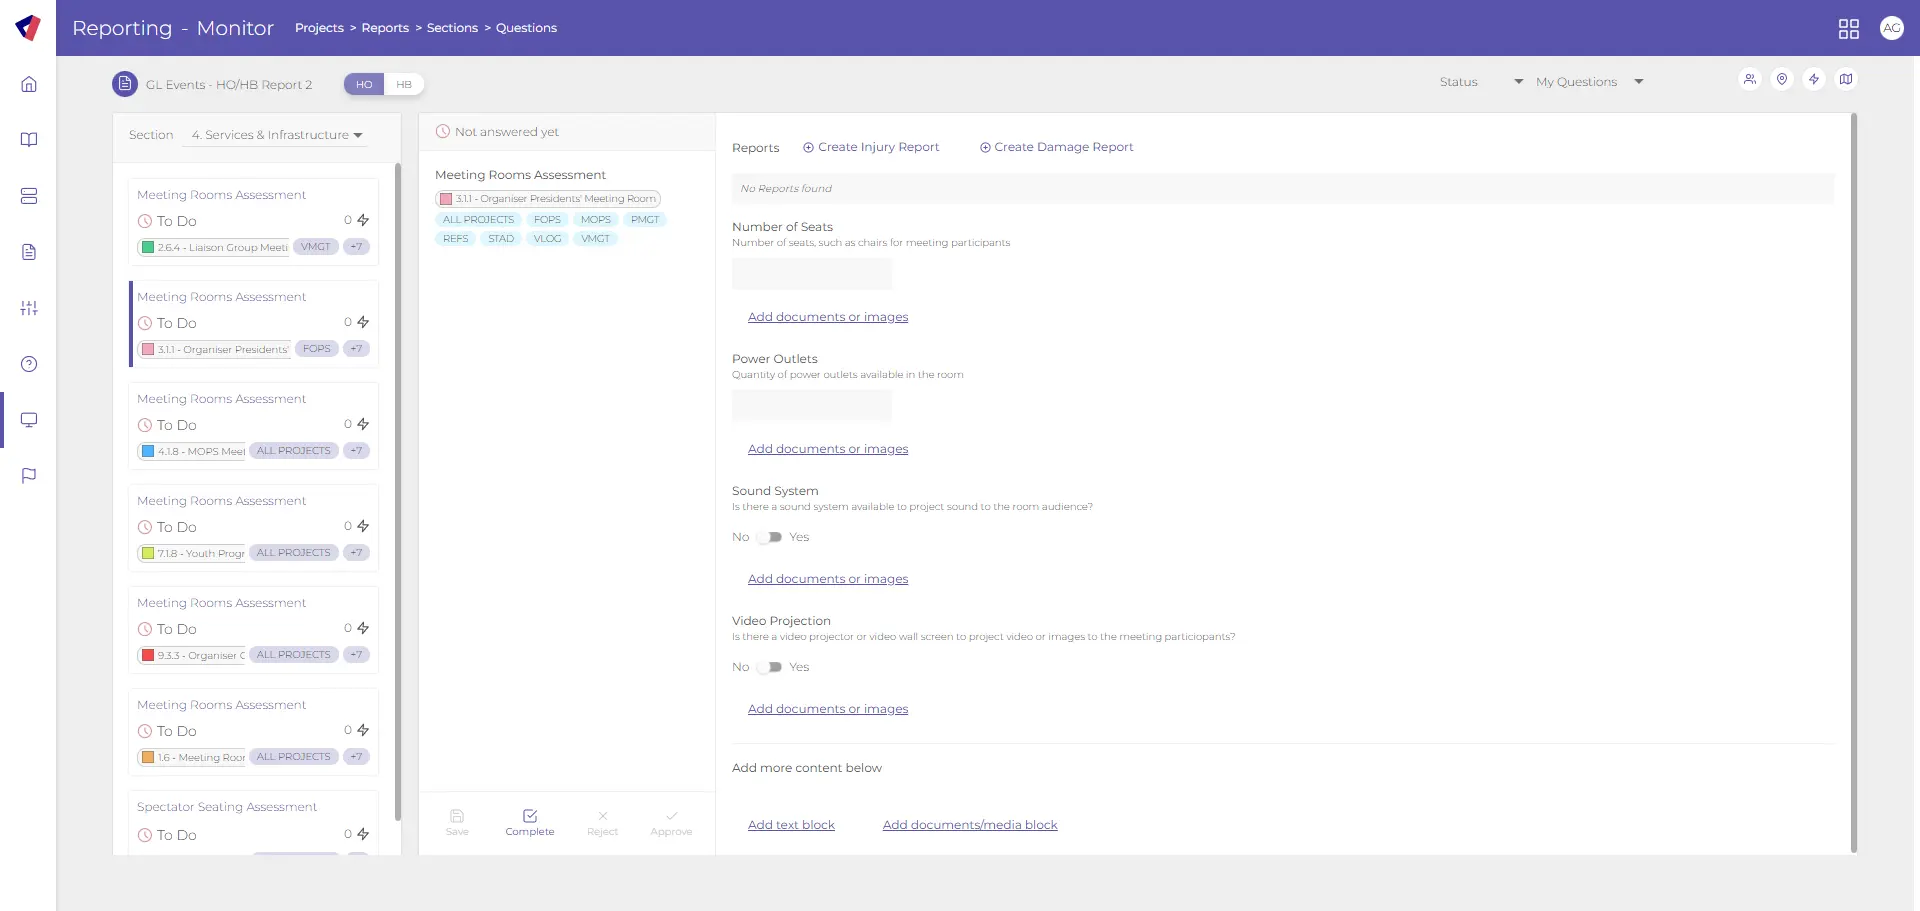
Standardization is what turns operational activity into consistent compliance evidence. With configurable questionnaires and checklists, every venue area is assessed using the same criteria, so you don’t end up with different teams interpreting “ready” differently across gates, stands, or compounds.
From an analytics standpoint, this structure makes your data comparable: you can measure completion rates, identify recurring failures and prove that mandatory checks were performed in the required sequence. It also strengthens the audit trail because each inspection record can include attachments (photos, documents, notes) captured at the moment of the check, rather than collected later. The result is fewer gaps, less rework and reporting that is defensible because it’s built on consistent inputs.
Standardization becomes even more powerful when it extends beyond the venue day itself into how teams capture and share findings. Modern site visit reporting is moving toward structured, collaborative, evidence-first reports that are created in real time during inspections.
Compliance usually fails in the follow-through phase: a problem is identified, but ownership is unclear, updates are scattered and resolution is hard to prove. Turning findings into tracked action points creates a measurable compliance loop: identify, assign, resolve, verify.
This is where event analytics becomes powerful. You can see open issues by severity, track time-to-close, and spot bottlenecks by area, contractor or event phase. Accountability becomes explicit because every item has an owner, a timestamped history and a status progression that’s visible to the right stakeholders. For sports events, that means fewer last-minute escalations and clearer proof that non-compliance items were handled within agreed SLAs.

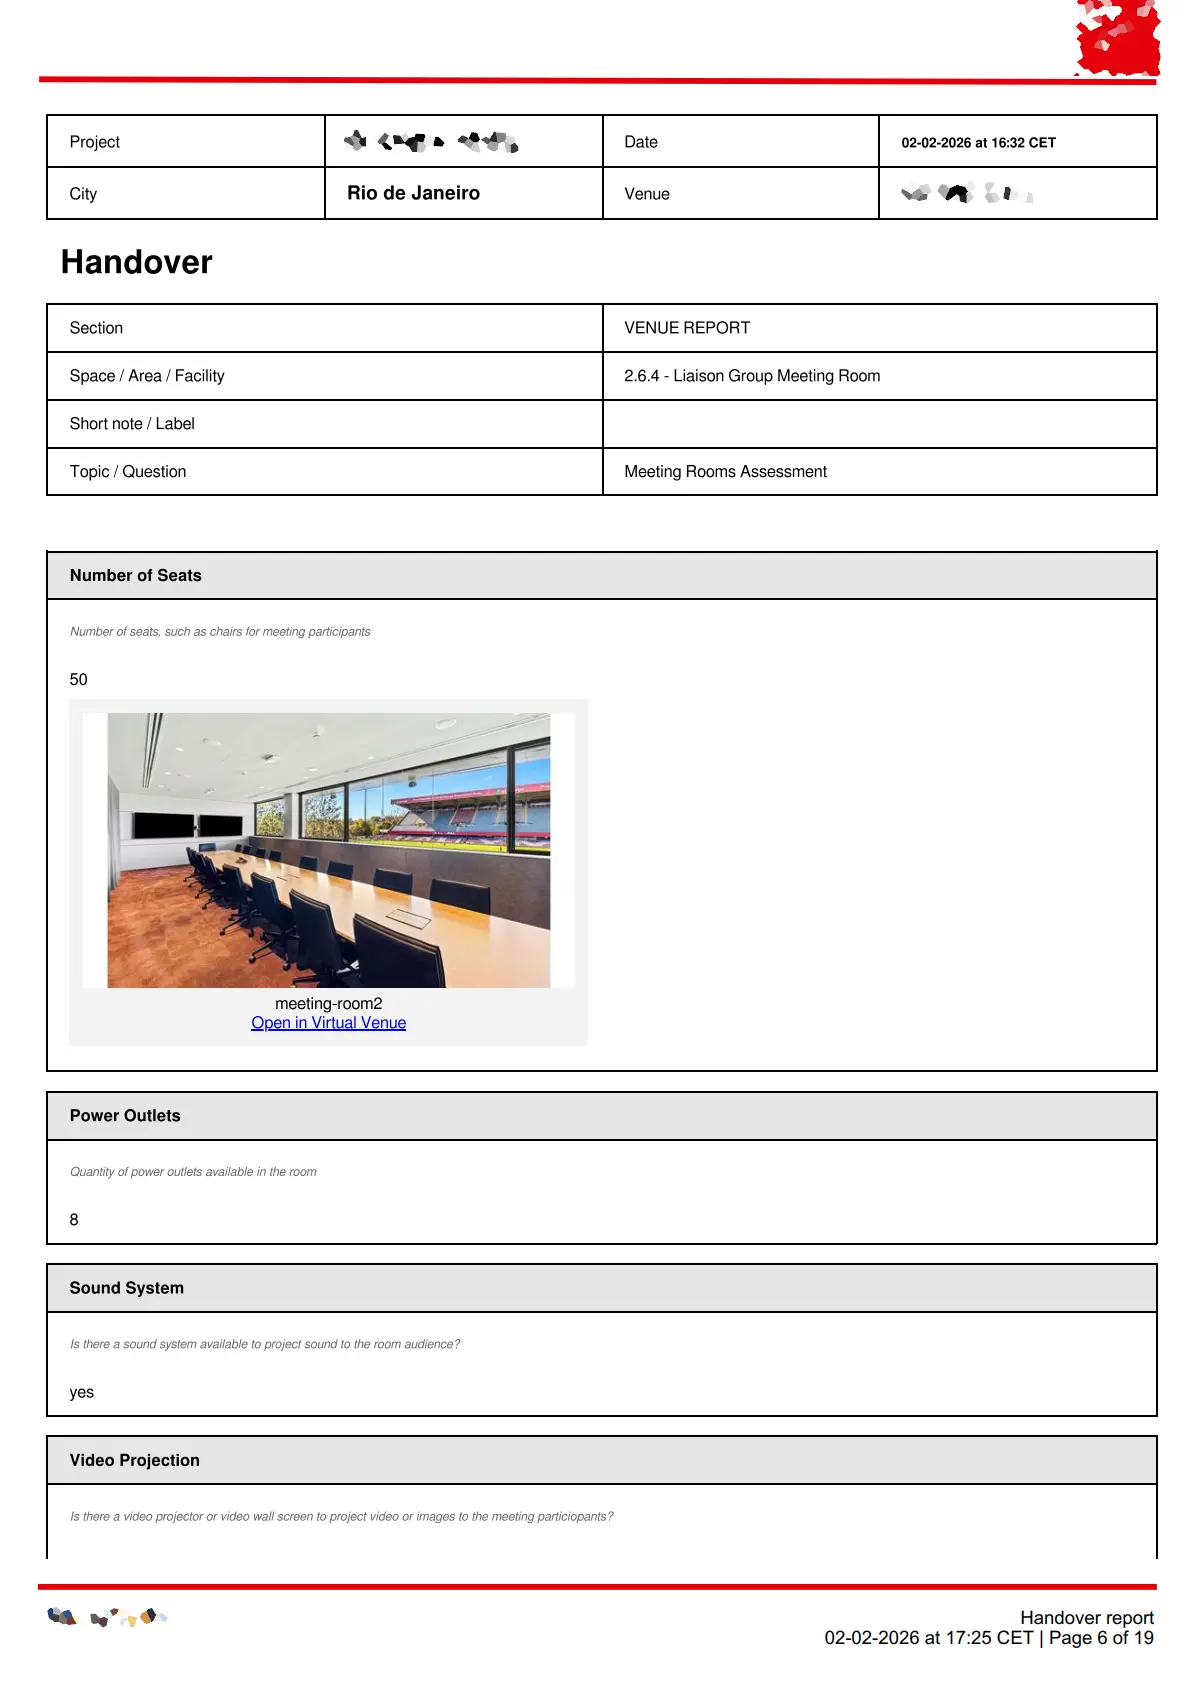
Handover and handback is one of the most compliance-heavy workflows in major events because it sits at the intersection of governance, contracts and operational risk. A robust handover/handback process documents the venue condition before and after the event with room-by-room detail, allowing organizers and venue owners to align on what was delivered and what needs fixing.
When records include onsite photos, digital signatures and damage reports linked to specific spaces and items, the evidence becomes highly defensible, especially in disputes involving contractors, insurers or venue management.
Analytics adds an extra layer: you can quantify readiness scores, track recurring damage hotspots and measure restoration progress post-event. This turns handover/handback from a reactive checklist into a traceable system of record.
In compliance reporting, the credibility of your evidence depends on control. If sensitive operational information can be edited freely, it’s easier to challenge later, whether in an audit, a governance review, or a dispute. Granular permissions create structure: different teams and external partners can collaborate without compromising the integrity of records. This is particularly important in large-scale sports events where many parties need access (security, contractors, venue ops, federation stakeholders), but not everyone should see or edit everything.
Role-based access control also improves operational efficiency: the right people get the right views, reducing noise and focusing attention where it matters. From an audit perspective, it supports governance expectations around responsibility, oversight, and controlled change.
Dashboards help you run the event, but compliance often ends in a deliverable that stakeholders can archive: a report package shared with federations, venue owners, authorities, insurers, or internal governance. Exportable reporting turns live operational work into structured documentation, typically a printable PDF plus supporting media (ZIP) with photos and attachments, so evidence doesn’t stay trapped in the platform.
The value here is speed and completeness: instead of manually compiling proof after the fact, teams can generate consistent outputs in minutes that captures the full story (what was checked, what was found, what was fixed, and what remains open). That reduces audit time, strengthens stakeholder confidence, and makes compliance reporting repeatable across events and seasons.
UEFA delivers matches in stadiums it doesn’t own. These venues are typically provided by clubs or federations, so a robust handover/handback process becomes essential to protect all parties. Virtual Venue supports this by helping UEFA document venue conditions before and after an event using structured location-based platform. Teams capture photos and notes room-by-room and zone-by-zone, creating a clear record of how the stadium was received and how it was returned.
This approach strengthens compliance reporting by creating a consistent, before/after evidence trail, linked to location and time, so responsibility is clearer and disputes are easier to resolve.
Ultimately, strong compliance reporting depends on data integrity, traceability and standardized execution across multiple stakeholders. By using event analytics to structure inspections, actions, approvals and venue condition evidence, sports organizations can produce audit-ready outputs with far less friction. In an environment where scrutiny is high and accountability is shared, that level of operational clarity becomes a must-have advantage.
See how the handover and handback process works in Virtual Venue.
Explore handover/handbackEvent analytics is the practice of collecting and analyzing operational event data like inspections, issues, approvals, and handovers to understand performance, reduce risk and produce reliable reporting. In sports events, it typically focuses on readiness, safety, logistics and post-event outcomes.
Compliance reporting is the documented proof that operational obligations were completed correctly, on time, with the right approvals and with traceable evidence. For large-scale sports events, that usually includes safety and security checks, venue condition, governance sign-offs, and sustainability or ESG requirements.
Event analytics strengthens compliance reporting by turning operational activity into structured, audit-ready records, showing what happened, where it happened, when it happened, who owned it, and what evidence supports it (photos, documents, signatures, logs).
Because “done” isn’t defensible without context. Map-linked event analytics ties checks, issues, and fixes to a precise room/gate/section, making compliance reporting easier to validate, harder to dispute, and faster to audit.
Common stakeholders include federations, venue owners, insurers, internal governance teams and sometimes public authorities. This is why exportable deliverables (PDF reports and ZIP evidence bundles) matter. Compliance reporting often needs to be archived and shared beyond the operations team.
Adopt an event analytics approach that standardizes inspections, tracks issues to closure, governs access, and produces exportable reporting. The biggest risk reduction usually comes from eliminating fragmented tooling and ensuring every action has an owner, timestamp, location, and evidence.
Latests from our Blog
See Virtual Venue in action
Streamline planning, enhance execution, and stay in full control with Virtual Venue.
Book a demo today and see how we can help optimize your events.
Get in Touch
All Rights Reserved © Virtual Venue


.svg)
.svg)
